Key Performance Indicators
Performance Evolution Trends (Jul-Aug 2025)
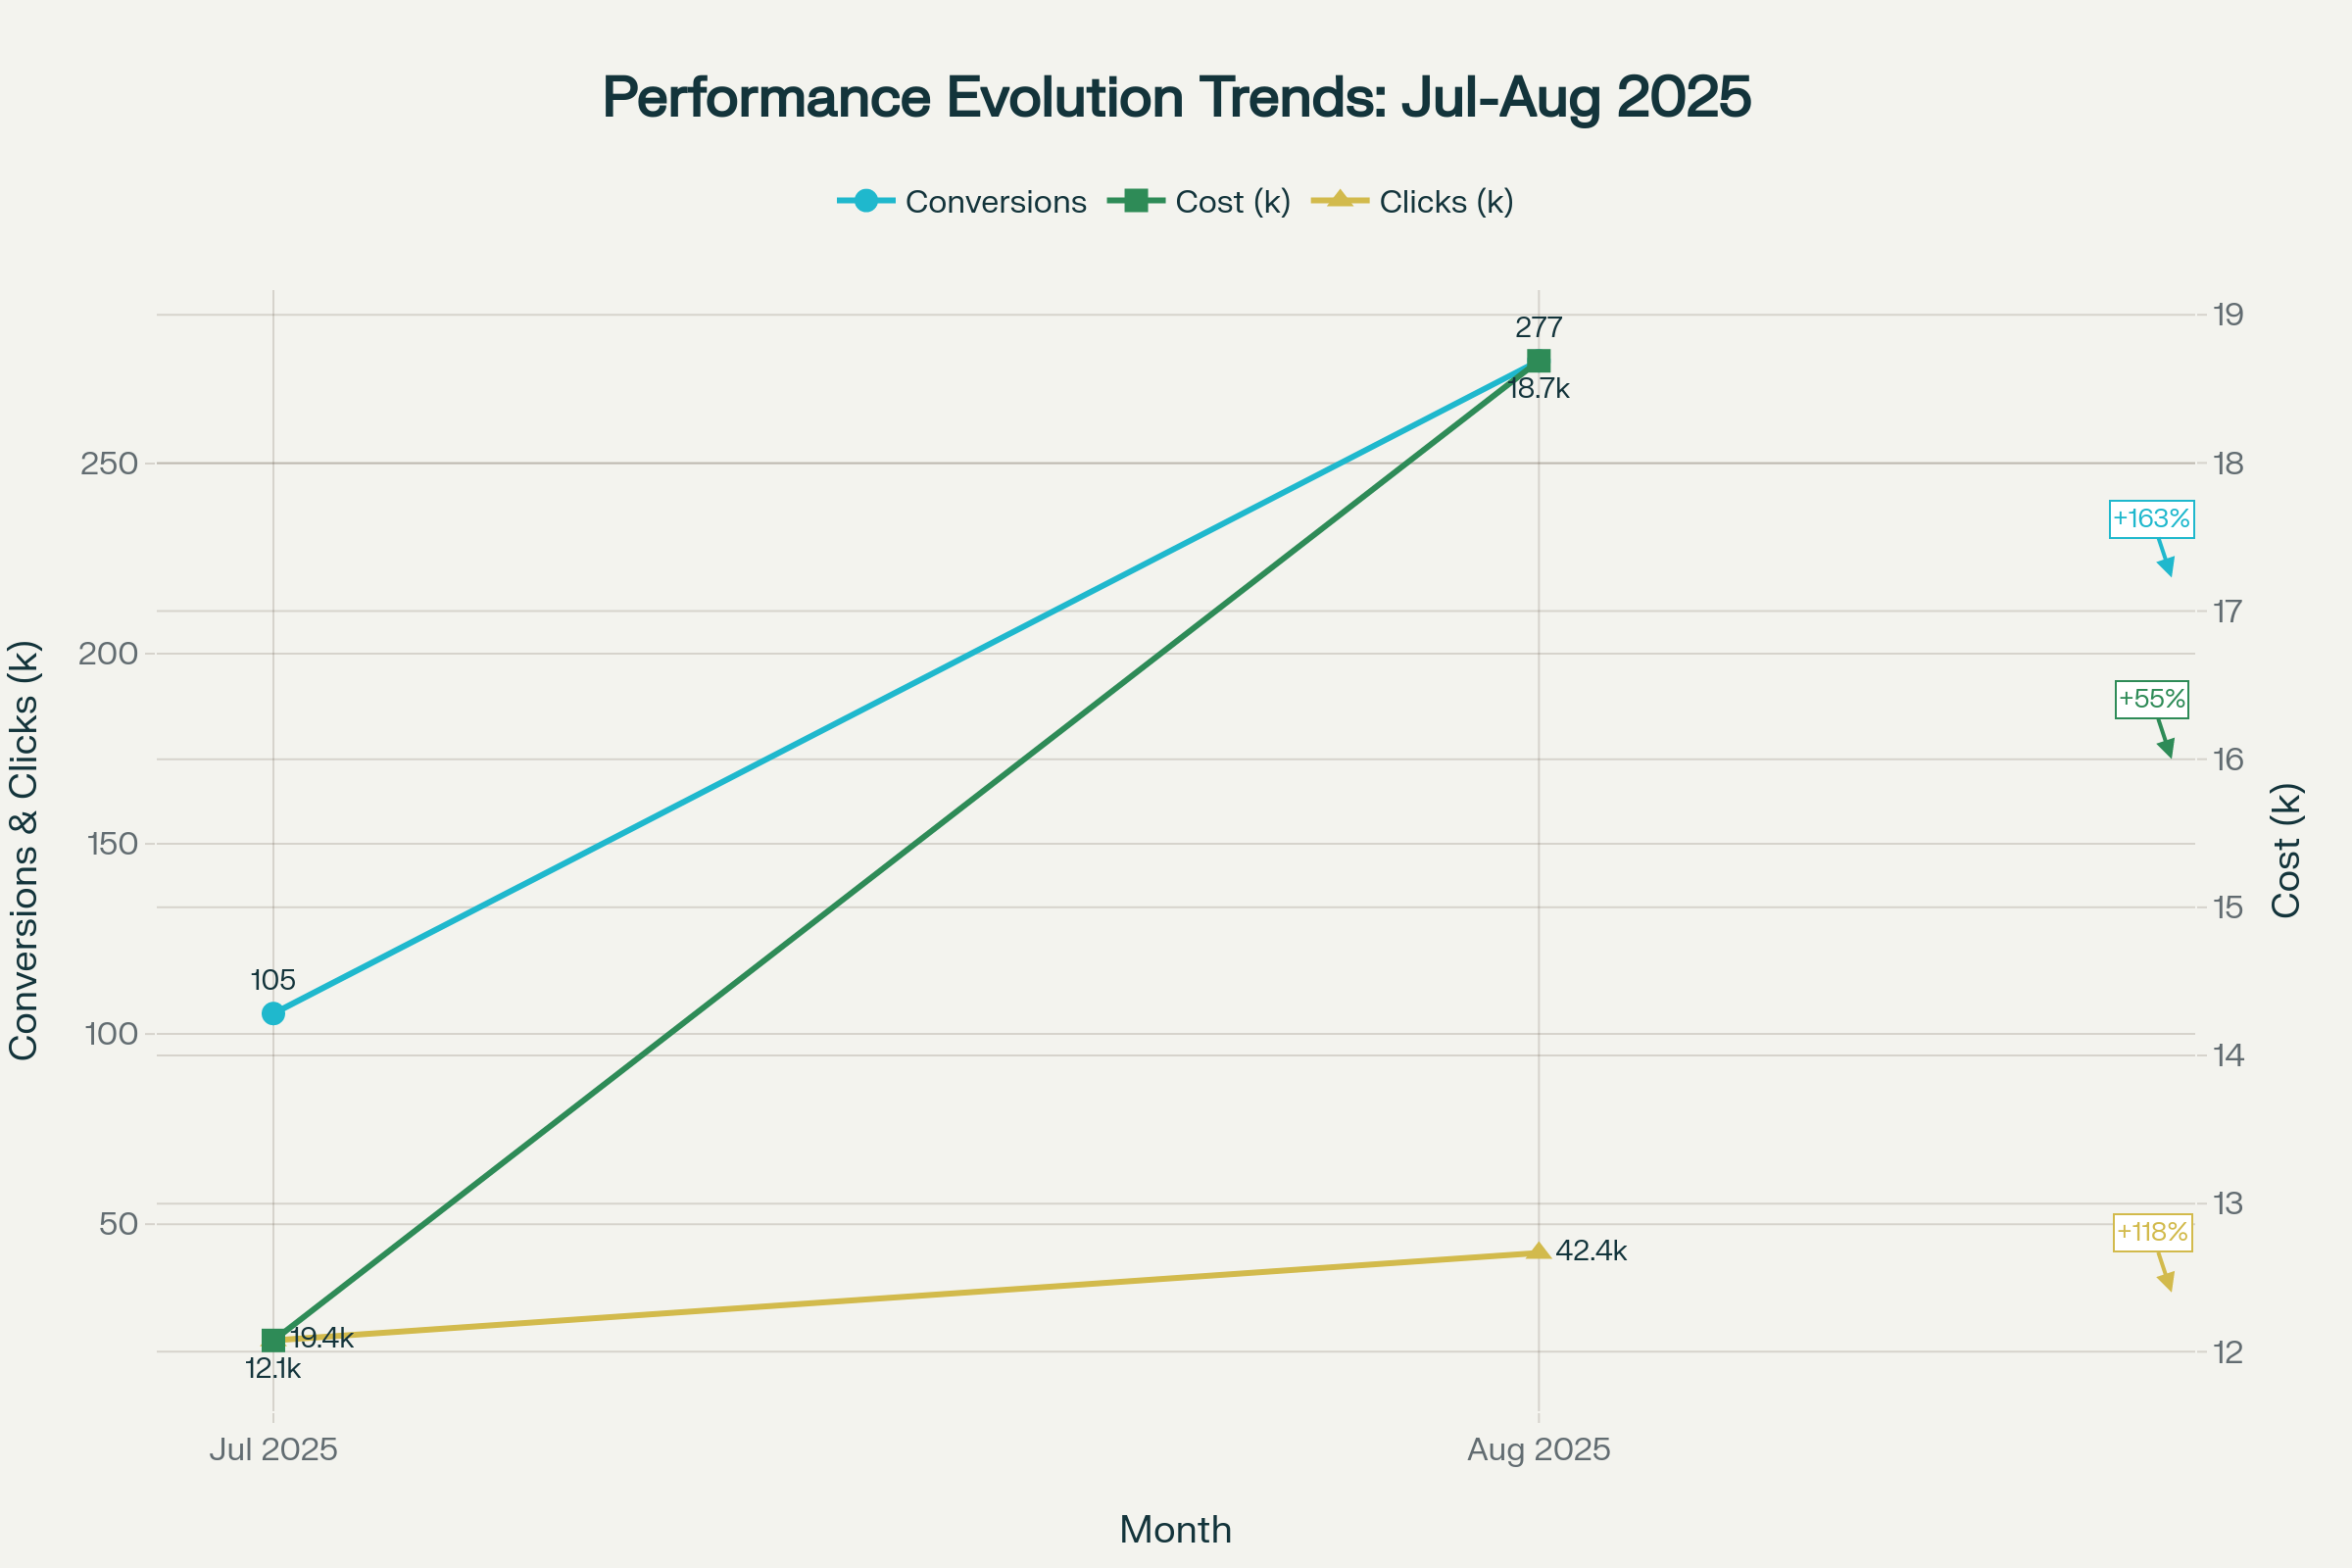
Comprehensive multi-line chart displaying key performance metrics evolution. Shows dramatic conversion growth from 105.4 to 277 (+162.9%), cost increase from $12.1K to $18.7K (+54.8%), and clicks growth from 19.4K to 42.4K (+118.5%).
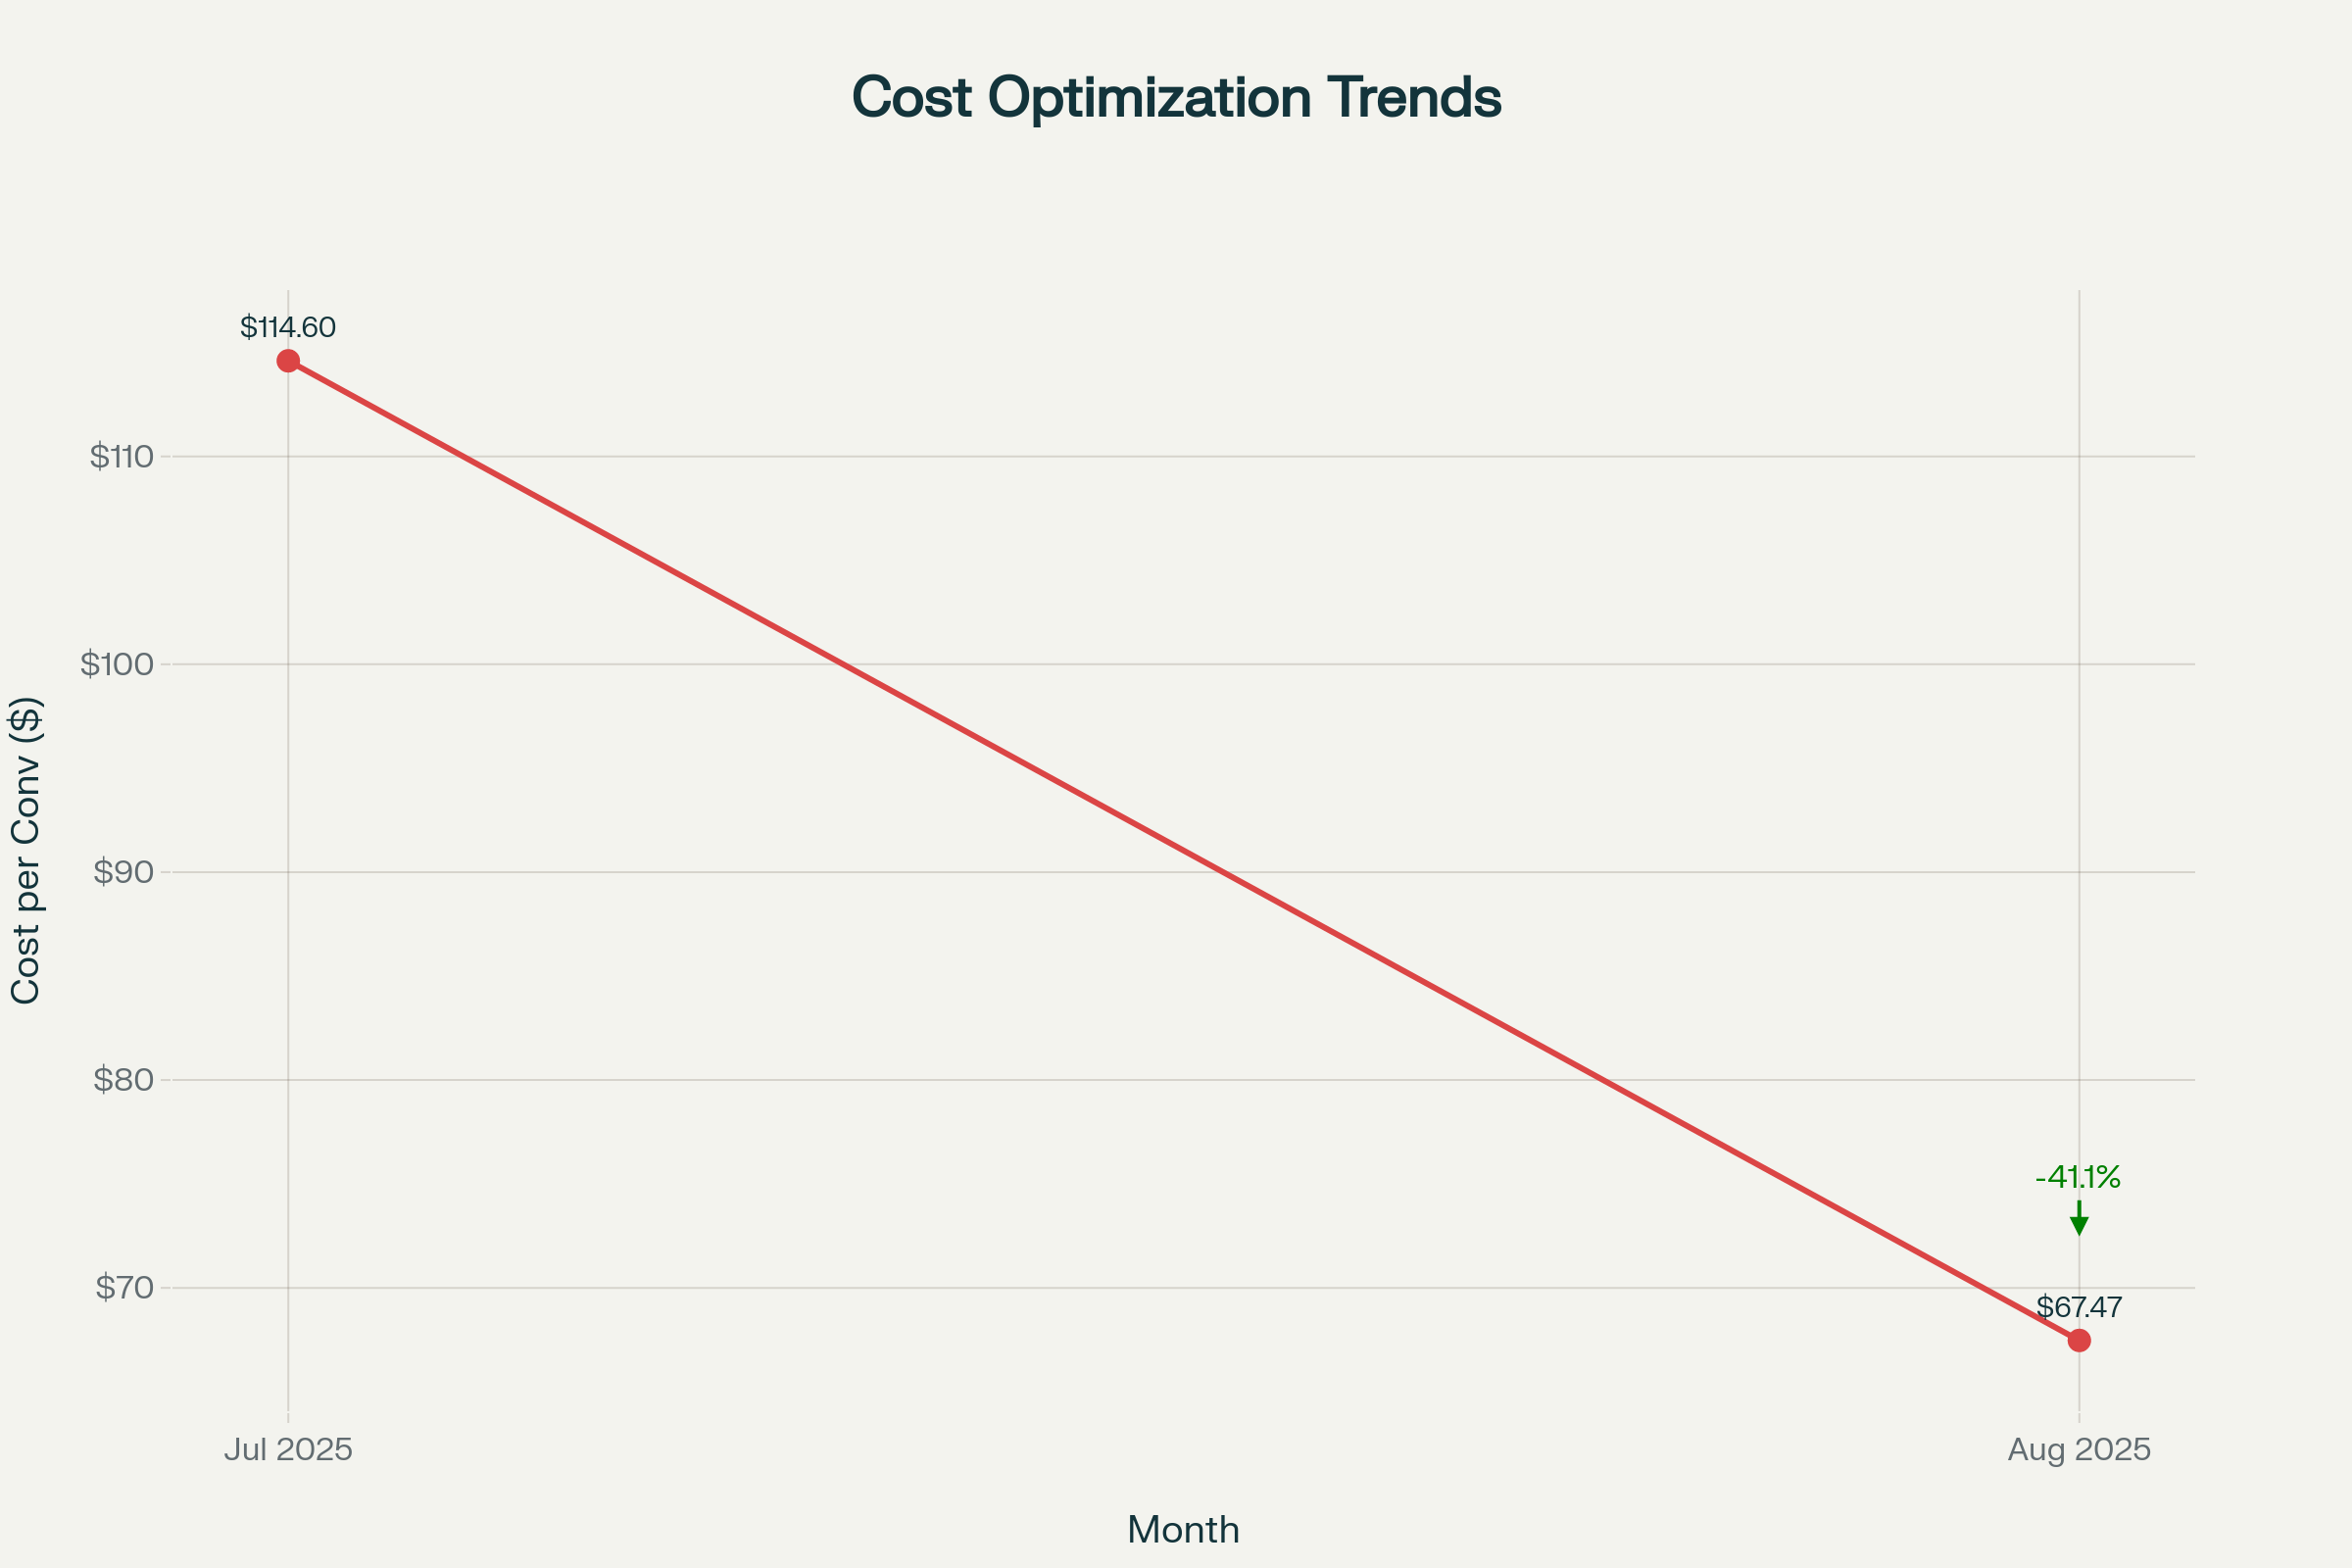
Dual-axis chart focusing on efficiency metrics. Shows significant cost per conversion improvement from $114.60 to $67.47 (-41.1%) while CTR decreased from 1.71% to 1.14%, demonstrating successful campaign optimization.
Executive Insights
Exceptional Growth
Conversions grew 163% from July (105.4) to August (277.0), demonstrating strong campaign optimization
Cost Efficiency Improved
Cost per conversion decreased 41.1% from $114.60 to $67.47, showing better ROI
Search Dominance
Search campaigns drive 59.6% of August conversions with strong performance consistency
Global Expansion
Converting locations expanded from 12 to 21, with Africa contributing 52.3% of total conversions
Demographic Intelligence
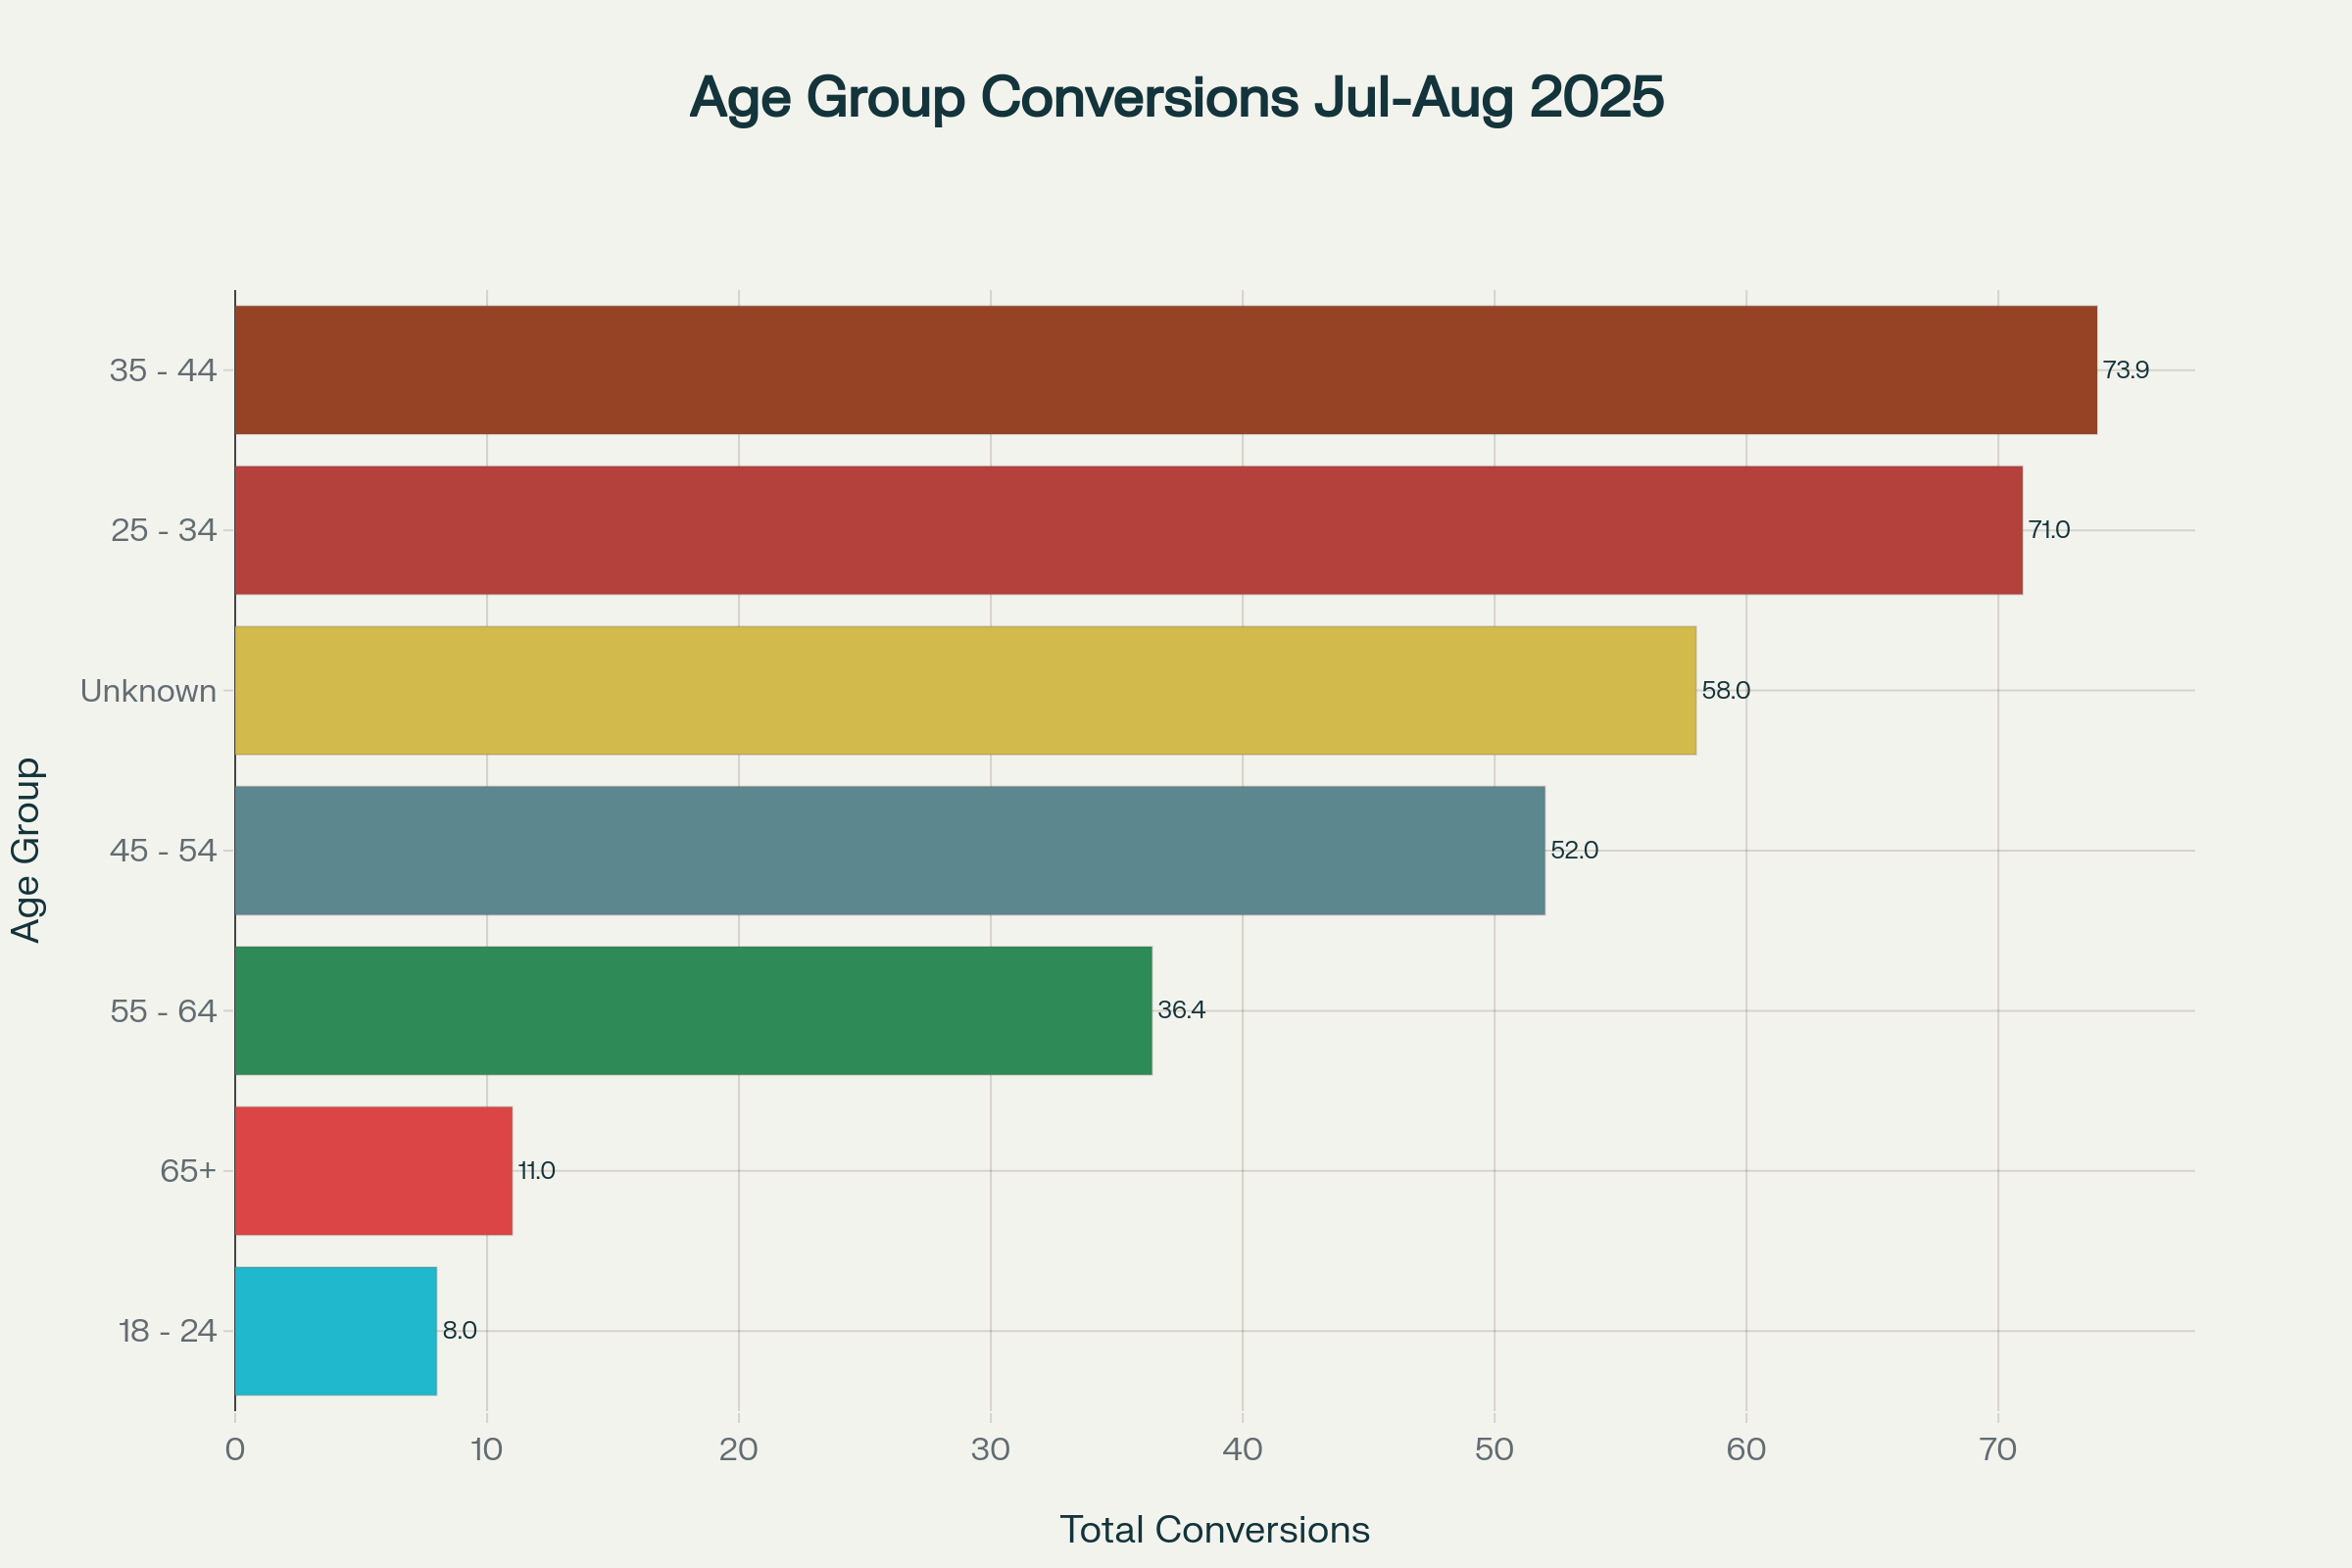
Age Group Performance: Total Conversions Jul-Aug 2025
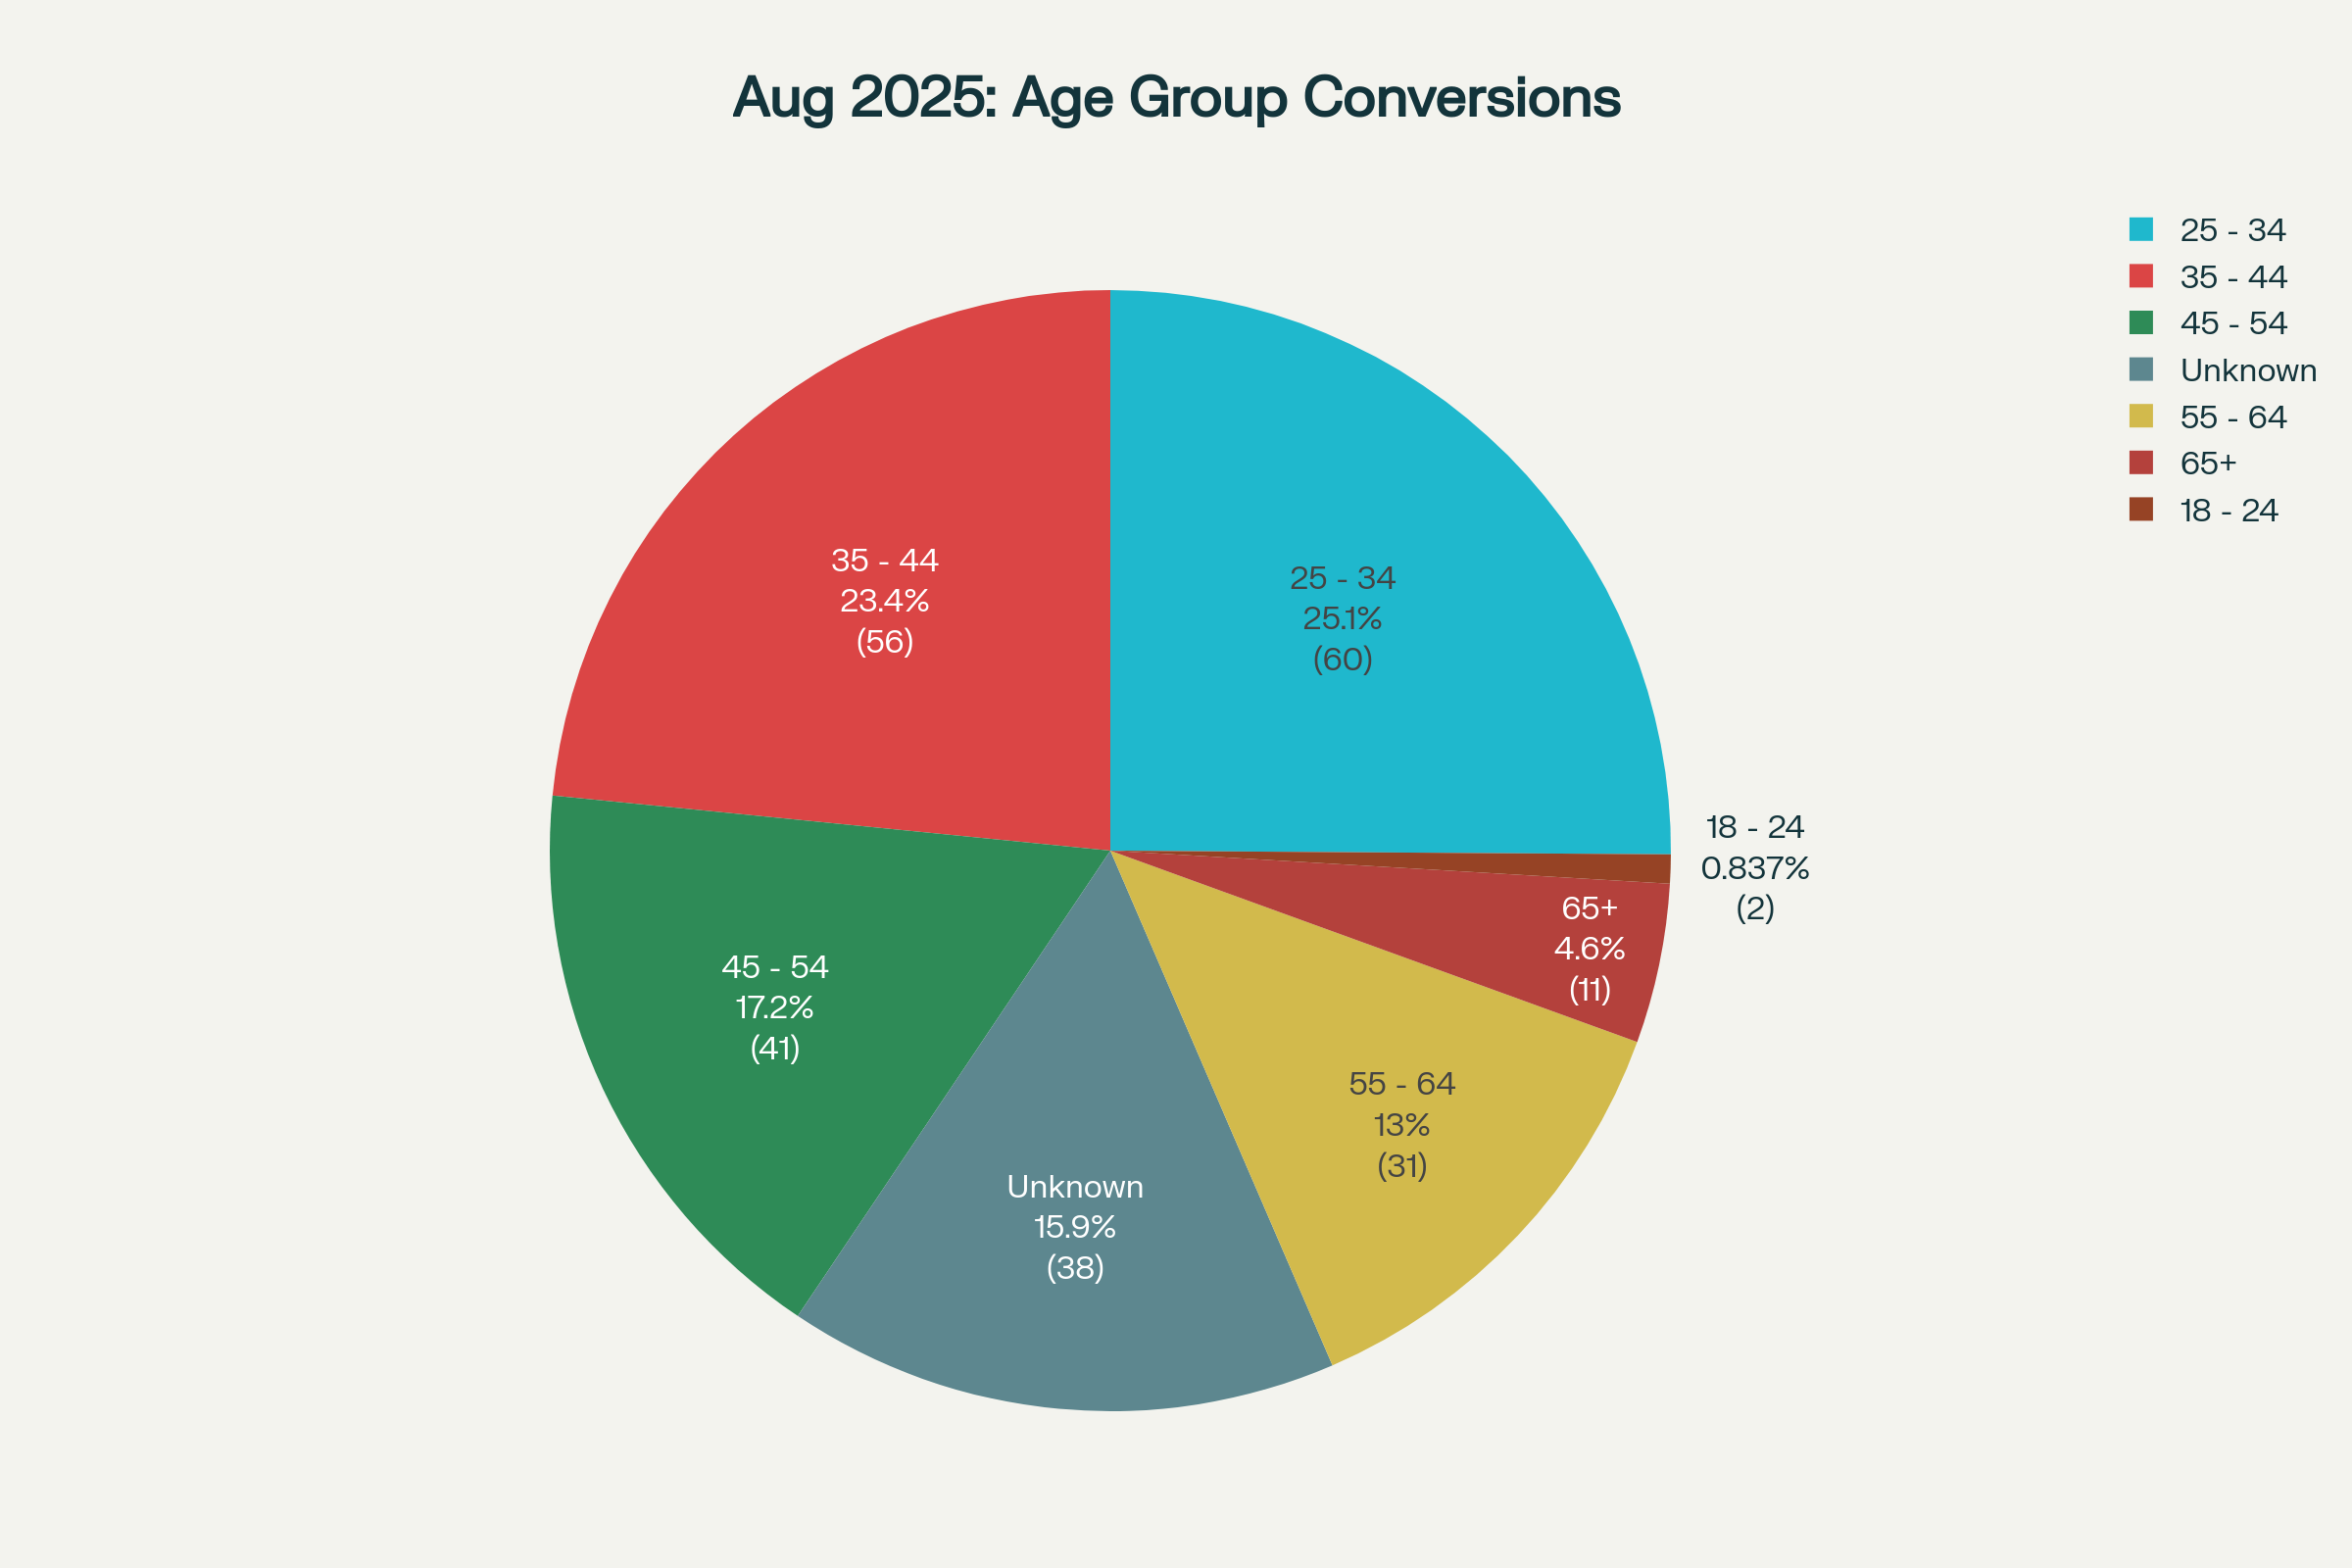
August 2025: Age Group Conversion Distribution
Detailed Age Group Analysis
| Age Group | Total Conversions | Total Cost | Cost per Conversion | Share of Total | Performance Rating |
|---|
Demographic Targeting Insights
Prime Demographics
25-44 age groups represent 37.8% of conversions with strong cost efficiency
Millennial Leaders
25-34 group leads August with 25.1% share, showing high engagement rates
Optimization Opportunity
Unknown age group shows 15.2% conversions - consider demographic expansion
Campaign Performance Analysis
Campaign Type Evolution: Jul-Aug 2025 Comparison
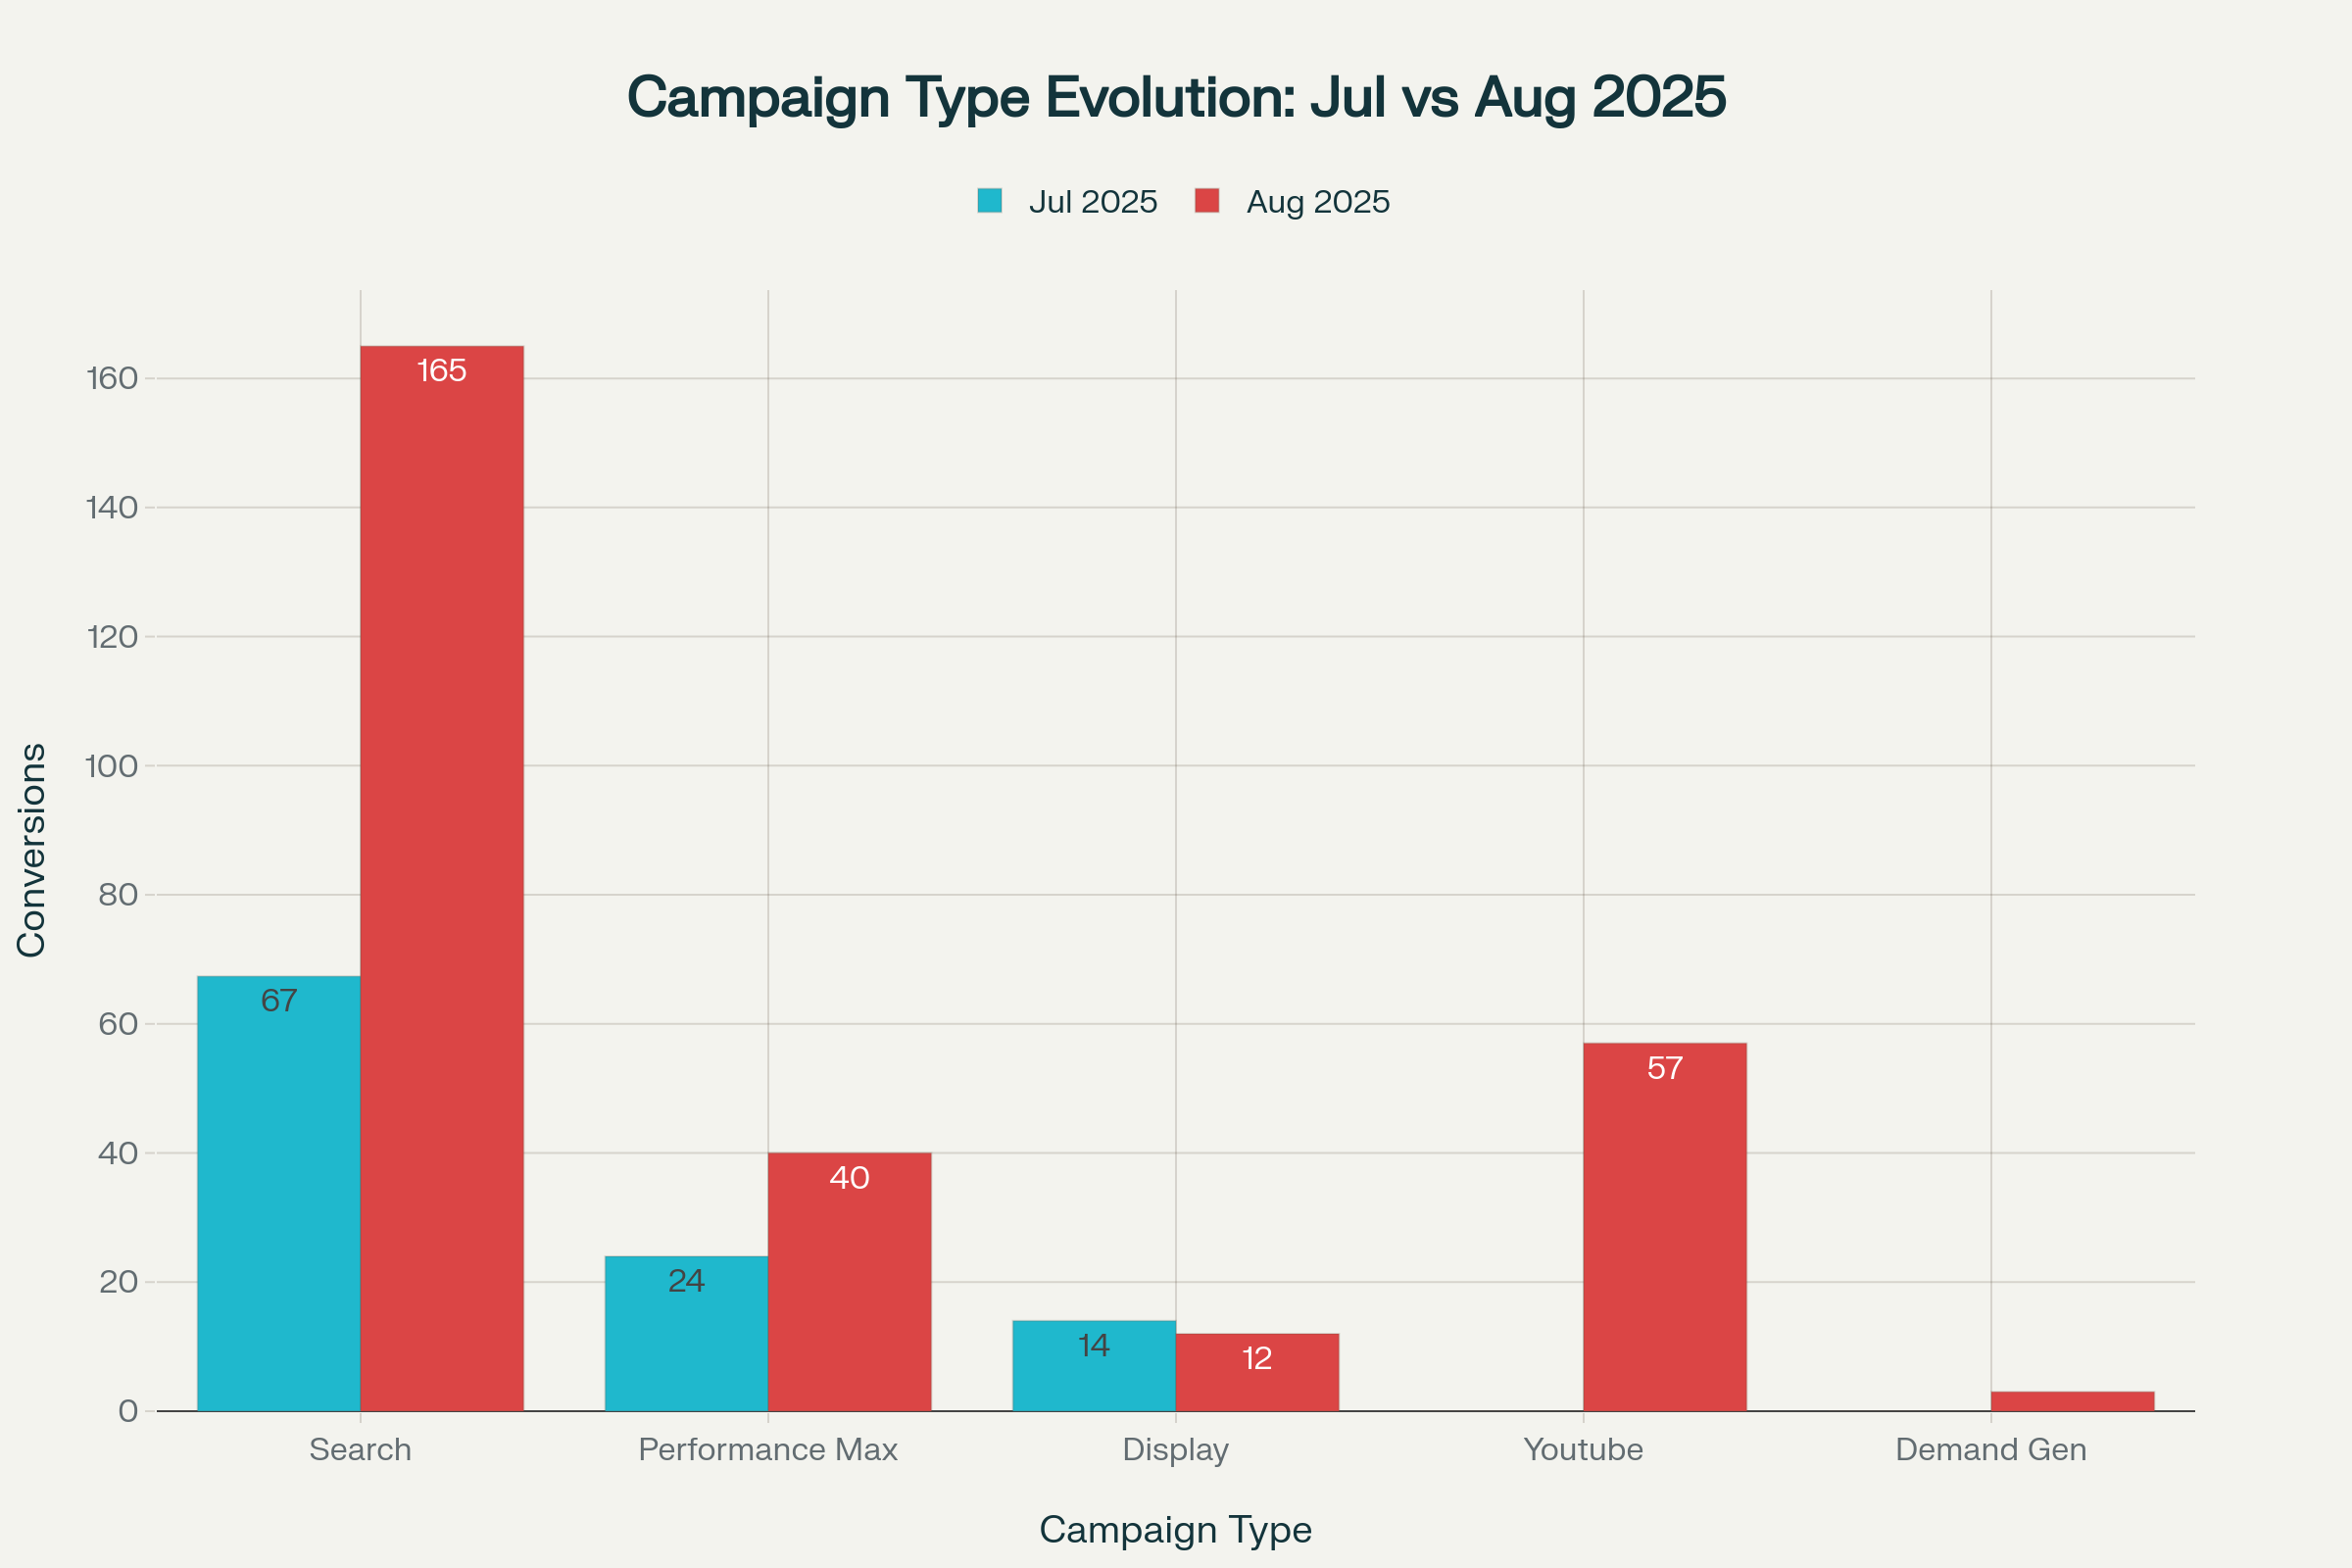
Search Campaigns
ExcellentYouTube Campaigns
New LaunchPerformance Max
GoodDisplay Campaigns
DecliningCampaign Optimization Insights
Search Excellence
Search campaigns show consistent high performance with 144.9% growth and strong ROI
YouTube Success
New YouTube campaigns generated 57 conversions in debut month, showing strong potential
Display Optimization Needed
Display campaigns declined 14.3% - consider creative refresh and audience adjustments
Geographic Performance Analytics
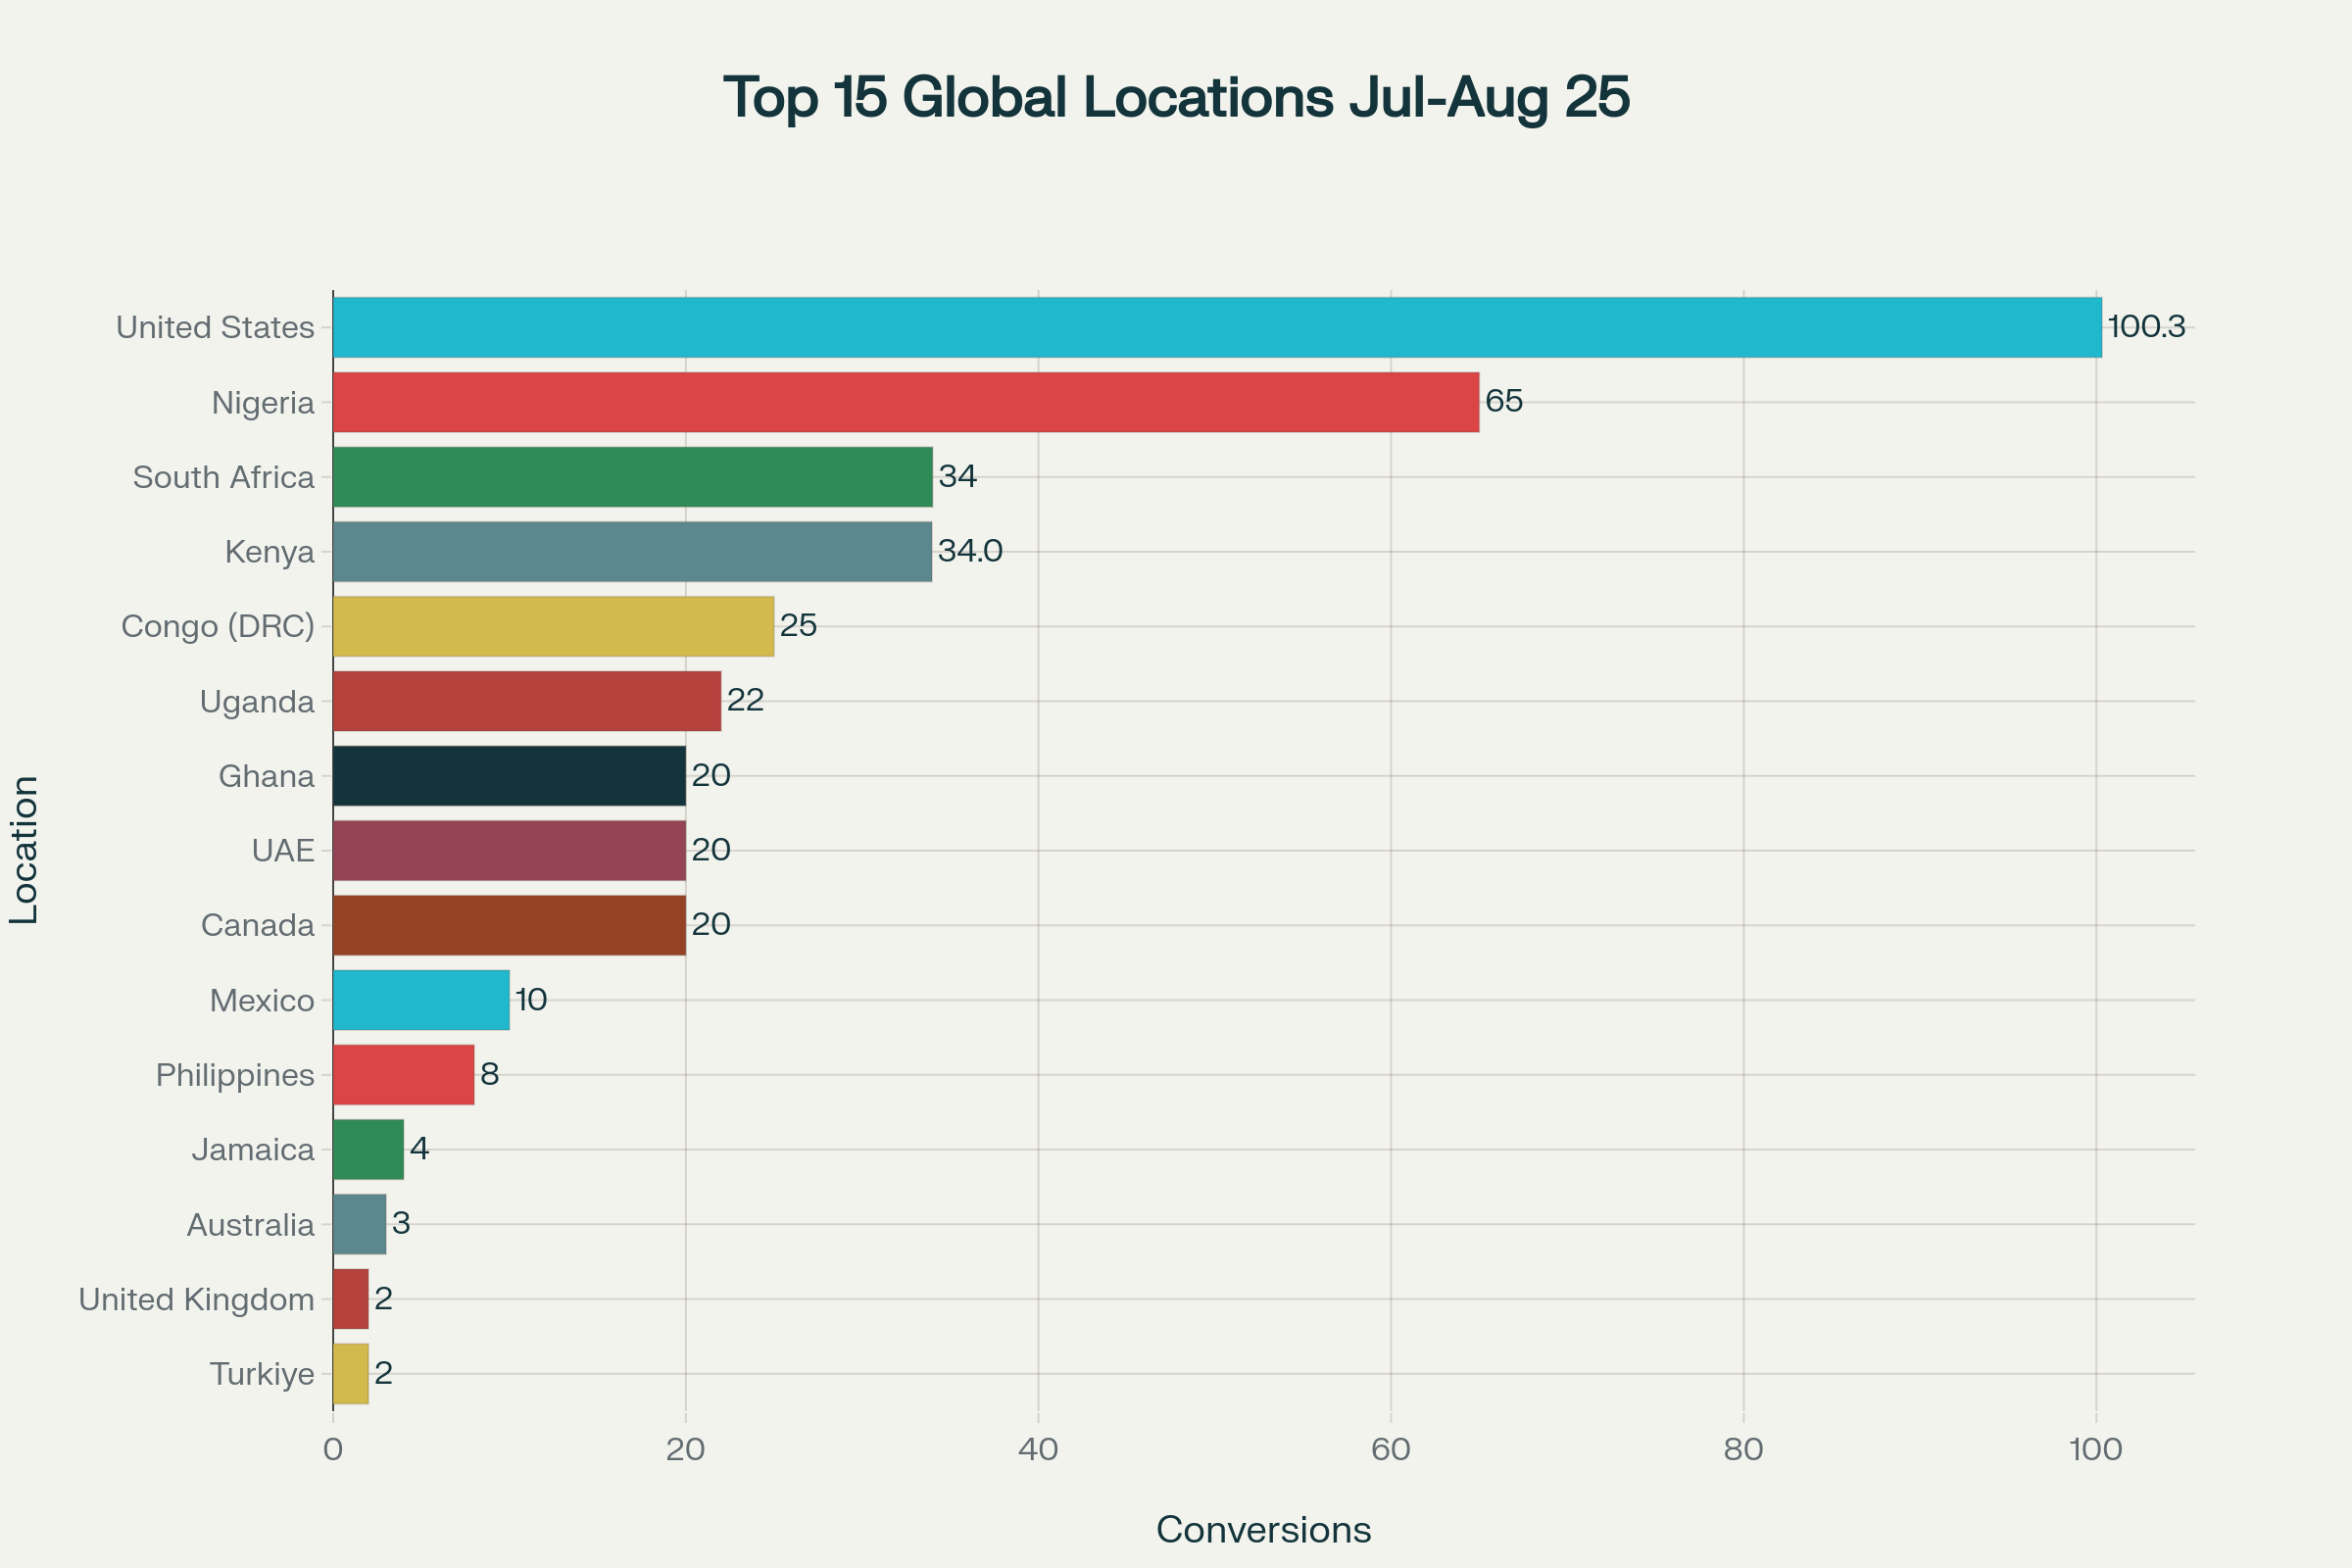
Top Global Markets: Total Conversions Jul-Aug 2025
Regional Breakdown
🌍 Africa
52.3%🇺🇸 North America
34.1%🕌 Middle East
5.8%🌏 Asia
3.1%Market Expansion Opportunities
US Market Leadership
United States leads globally with 100.3 conversions, showing strong brand presence
Africa Powerhouse
Africa region contributes over half of all conversions (52.3%) with diversified markets
Geographic Expansion
Converting locations grew from 12 to 21, indicating successful market penetration
Advanced Analytics & Data Explorer
Executive Performance Summary
Conversion Performance
Cost Efficiency
| Age Group | Conversions | Cost | Cost/Conv | Share |
|---|
| Campaign Type | Jul Conversions | Aug Conversions | Growth % | Aug Share |
|---|
| Location | Conversions | Cost | Region | Performance |
|---|